
What is SAP Analytics Cloud?
SAP Analytics Cloud (or SAP Cloud for Analytics) is a business intelligence (BI) platform provided by SAP as a software as a service (SaaS). The purpose of Analytics Cloud is to provide all analytics capabilities to all users in a single solution. It integrates the needs of Business Intelligence, Predictive Analytics, and Organizational Planning. It also incorporates a new product known as “digital boardroom.” The HANA platform enables applications to take advantage of in-memory and advanced data processing features.
The SAP Analytics Cloud product arose from the February 2015 release of SAP Cloud for Planning. In addition to business planning, the other key components are BI (for reporting, Dashboarding, data discovery, and visualization), predictive analytics and governance, risk, and compliance (GRC). The BI functionalities were introduced in 2015, with the predictive capabilities following later.
SAP Analytics Cloud, which is built on SAP HANA Cloud Platform (HCP), allows data analysts and corporate decision-makers to visualize, plan, and predict data in a secure, cloud-based environment. Other BI solutions, according to SAP, often need data to be integrated from several sources and users to travel between different programs when performing tasks like preparing reports. According to SAP, Analytics Cloud users may work more efficiently because all data sources and analytics operations are contained in one package. The major functions are accessible through the same user interface, which is geared for business users’ simplicity of use.
SAP Analytics Cloud features
It offers a number of features, including real-time data analysis, better planning throughout the organization, dashboard & designing the story, analytics designer, and exploring the data. The SAP Analytics Cloud’s features are categorized into five:
Business Intelligence
Data from several sources can be integrated, displayed, and then presented and shared as a report using self-service business intelligence tools. Users can access different data sources in all business sectors in real-time using data connectors, regardless of the volume of data to be processed – whether On-premise or in the cloud, SAP Business Warehouse or SAP HANA, SAP S/4HANA, or non-SAP apps.
The SAP Analytics Cloud also allows for simplified business reporting. Users can explore data and discover correlations using various filter and drill-down functions (navigation in hierarchical data). After that, the data and correlations can be viewed.
Ad-hoc reporting functions for big data analysis and what-if analyses are also included in the application.
Planning
The SAP Analytics Cloud also provides corporate planning features. Financial and operational plans can be established and integrated into one platform with the help of these functions.
Machine learning and other modern technologies enable businesses to plan “intelligently.” Companies can use access rights management to limit access to critical data and set up reminders and notifications for team members, for example. Plans can be discussed, communicated, and agreed upon.
Dashboard & story design
When it comes to performance improvement, users can use the application-generated recommendations to help them create a report. Only edit view is available for recommendations highlighted with an exclamation point icon or an information symbol, and their content becomes visible after lingering over the cursor. Reducing the number of pages or GUI elements, enabling the Optimized View Mode function, and collapsing data filtering items are all suggestions.
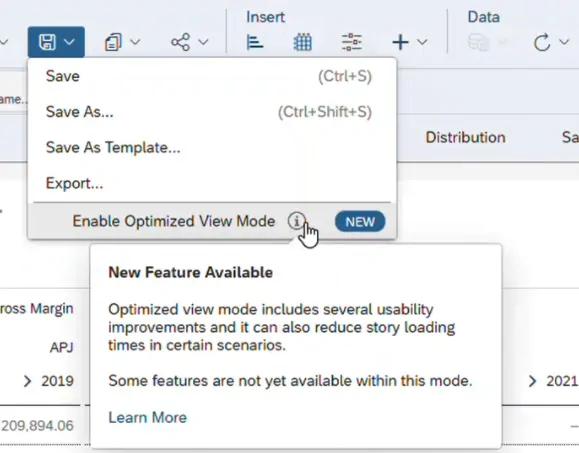
When Optimized View Mode is enabled, users can do things like:
- Changes to the data can be undone or restored. Actions that have no impact on the data, such as changing the report page, are ignored.
- Consolidating the data and tooltips that appear on the visualization after a data point is selected into a single unified panel closer to the pointer for better access to available features.
- Benefit from changes in the presentation of elements used for data filtering – the drop-down list, which consists of many levels of the hierarchy, by default only includes active items, slowing down the processing speed. The list is dynamically scrolled so that the subordinate items in the hierarchy are always in the middle, and the parent record in the categorization structure is at the top.
Analytics Designer
The module enables SAP Analytics cloud services to be integrated and adds great flexibility to the implementation of business solutions by allowing users to create interactive presentations as well as planning and analytical applications. Since the fourth quarter, the analytics designer has allowed users to create a diagram that graphically depicts correlations and relationships among particular application elements. Aside from serving as a source of information, the diagram can also be used to edit and alter existing connections.
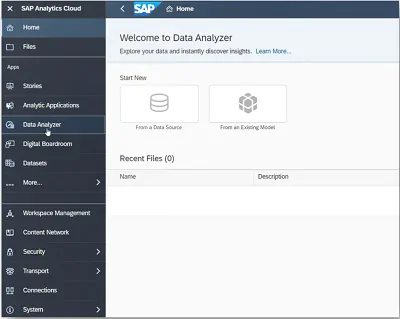
Data Exploration
Enhancements to the Data Analyzer module will undoubtedly assist users who want to do in-depth, more insightful research. It will also be accessible from the side navigation bar in Q4. The improvements will be carried over to the module’s homepage, allowing for easy access to data sources (SAP Business Warehouse, SAP HANA) and analysis. Formatting measures and their default values have been added to the Data Analyzer, as well as the ability to change parameters by selecting the measure, how units and currencies are shown, and the number of decimal places displayed.
SAP Analytics Cloud vs Tableau
Tableau is a business intelligence tool that is similar to SAP Analytics Cloud. Tableau, on the other hand, is divided into the desktop, server, and internet apps. Tableau Desktop is a desktop program, Online is a software as a service offering, and Tableau Server is used to share reports, dashboards, and data sources across larger enterprises.
Tableau features
- Dashboards for mobile devices
- Management for metadata
- Rollback revision history
- No-code data queries
- REST API
- Document API for .twb and .tds files
Tableau is as user-friendly as SAP Analytics cloud, but it has fewer data preparation and blending options, less product support, and may operate slower on older hardware. Tableau is a powerful data visualization tool that is a viable replacement for SAP Analytics.
Use Cases of SAP Analytics Cloud
Executive Dashboards: SAC empowers executives to monitor key performance indicators (KPIs), track business metrics, and gain a holistic view of their organization’s performance through interactive dashboards. Real-time data updates and intuitive visualizations enable executives to make data-driven decisions quickly.
Sales and Marketing Analytics: Organizations can leverage SAC to analyze sales and marketing data, such as customer behavior, market trends, and campaign performance. This helps in identifying potential sales opportunities, optimizing marketing strategies, and improving overall customer satisfaction.
Financial Planning and Analysis: SAP Analytics Cloud provides finance teams with advanced planning capabilities, enabling them to create accurate financial forecasts, perform variance analysis, and drive budgeting and forecasting processes more efficiently. It allows finance professionals to collaborate with other departments and align financial goals with business objectives.
Supply Chain Analytics: With SAC, businesses can gain real-time visibility into their supply chain operations, analyze inventory levels, monitor logistics performance, and identify bottlenecks or inefficiencies. This helps in optimizing the supply chain, reducing costs, and improving overall operational efficiency.
Conclusion
SAP Analytics Cloud is a powerful analytics solution that empowers organizations to harness the full potential of their data. By combining business intelligence, augmented analytics, and planning capabilities in a unified platform, SAC enables businesses to make data-driven decisions, uncover valuable insights, and drive digital transformation. Whether it’s executive dashboards, sales and marketing analytics, financial planning, or supply chain optimization, SAP Analytics Cloud offers a wide range of use cases and benefits for organizations across industries. Embracing SAC can be a game-changer for businesses looking to thrive in the age of data-driven decision-making.
